

Table of contents
- How To Open The Chrome Dev Tools?
- Tip #1: Finding an Element
- Tip #2: Add and Edit CSS Elements Directly
- Tip #3: Change Position Of Elements
- Tip #4: Locate CSS Property In Sources
- Tip #5: Screenshot An Element
- Tip #6: Continue Console Operation
- Tip #7: Multi-Lines Scripting Feature in the Console
- Tip #8: Locators For Selenium Automation Testing
- Tip #9: Clear Cookies
- Tip #10: Reach Specific Line and Column Directly
- Tip #11: Switch Files Within Project
- Tip #12: Watch Expression
- Tip #13: JavaScript Breakpoints
- Tip #14: XHR/Fetch Breakpoints
- Tip #15: Initialise Multiple Cursors
- Tip #16: Monitor Performance
- What If I Told You Can Access Chrome Dev Tools On LambdaTest While Cross Browser Testing?
Google Chrome is the most used browser as of 2019 (Global Browser Stats). Google seems to continue to hold its position 1 for at least a couple of years, if not more! Holding the most dominant browser market share makes it an inevitable part of the cross browser testing checklist of every QA manager. One of the most valuable features that have become an indispensable part of every web developer’s and web tester’s daily routing is Chrome Dev Tools.
Being of this importance, it is absolutely necessary for the testers to know how they can leverage Chrome Dev Tools to their full extent and perform better testing. Although developer tools are available in all the major browsers to help their fellow developers debug any UI issue, cross browser compatibility issue, Google Chrome is always striving to add more features to help professionals get the hang of Chrome Dev Tools more conveniently.
In this post, we will highlight the top 16 tips to use Chrome Dev Tools for cross browser testing. However, if you are just starting out as a web developer or web tester then we will start off with a basic section to help you open the developer tools in your browser.
Did you know? The annotation rules defined in this section apply to ruby annotations. These rules are applied only to foreign language annotations, and not to those that are part of the content of the document.
How To Open The Chrome Dev Tools?
Before working with the different tips for developer tools on Google Chrome, a tester should know beforehand about how to open Chrome Dev Tools. Developer tools in Google Chrome can be accessed by the following methods:
- Open your Google Chrome browser. Go to the website on which you want to debug. Perform a right-click on the screen and go to inspect.
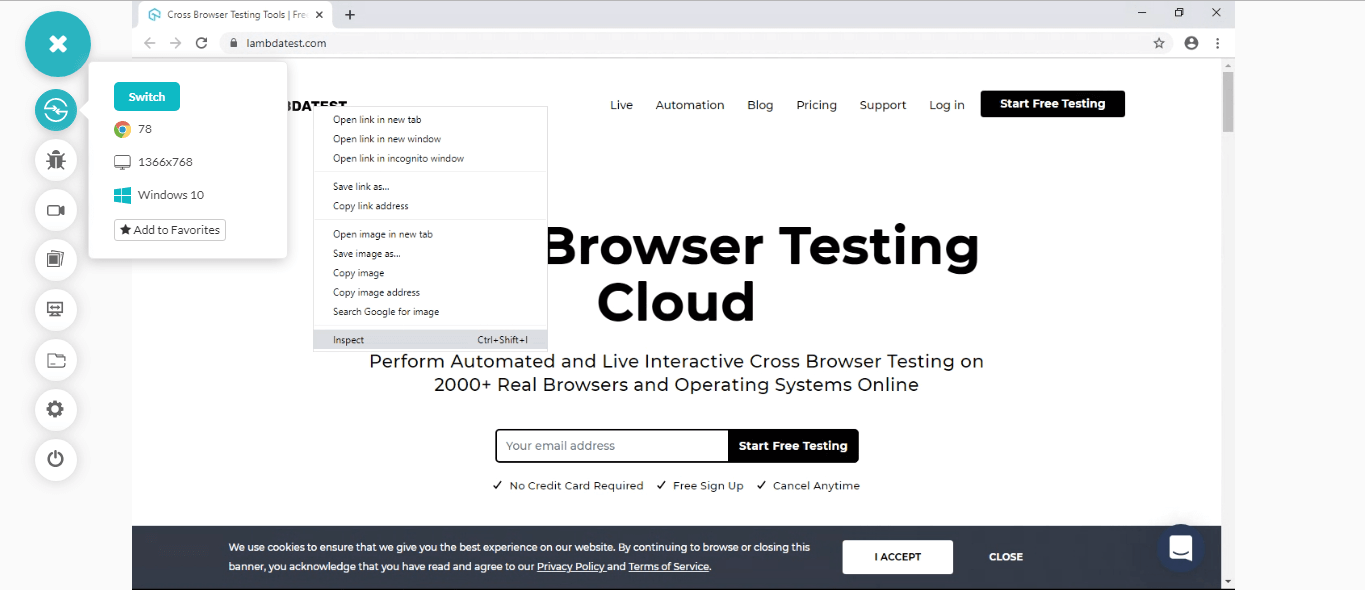
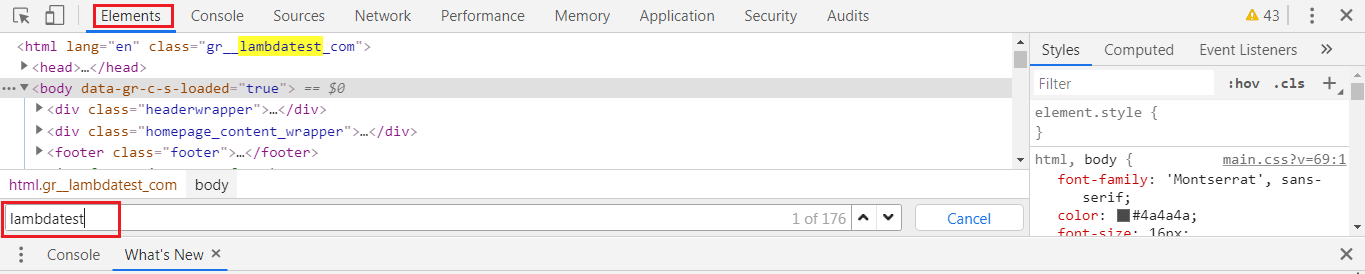
The above screenshot is of LambdaTest, a cross browser testing tool on-cloud. LambdaTest offers both manual and automated browser testing on 2000+ real browsers running on real operating systems. Automated browser testing is facilitated using an online Selenium Grid. On LambdaTest, you can open the Google Chrome browser of your choice and right-click –> inspect to open the developer tools panel.
- Another way to access Chrome Dev Tools is by using the keyboard shortcuts. You can either press Ctrl + Shift + C (Cmd + Option + C) or Ctrl + Shift + J(Cmd + Option + J).
Similarly, you can also leverage Developer tools in other browsers. Here is how you may open developer tools in Mozilla Firefox and Safari.
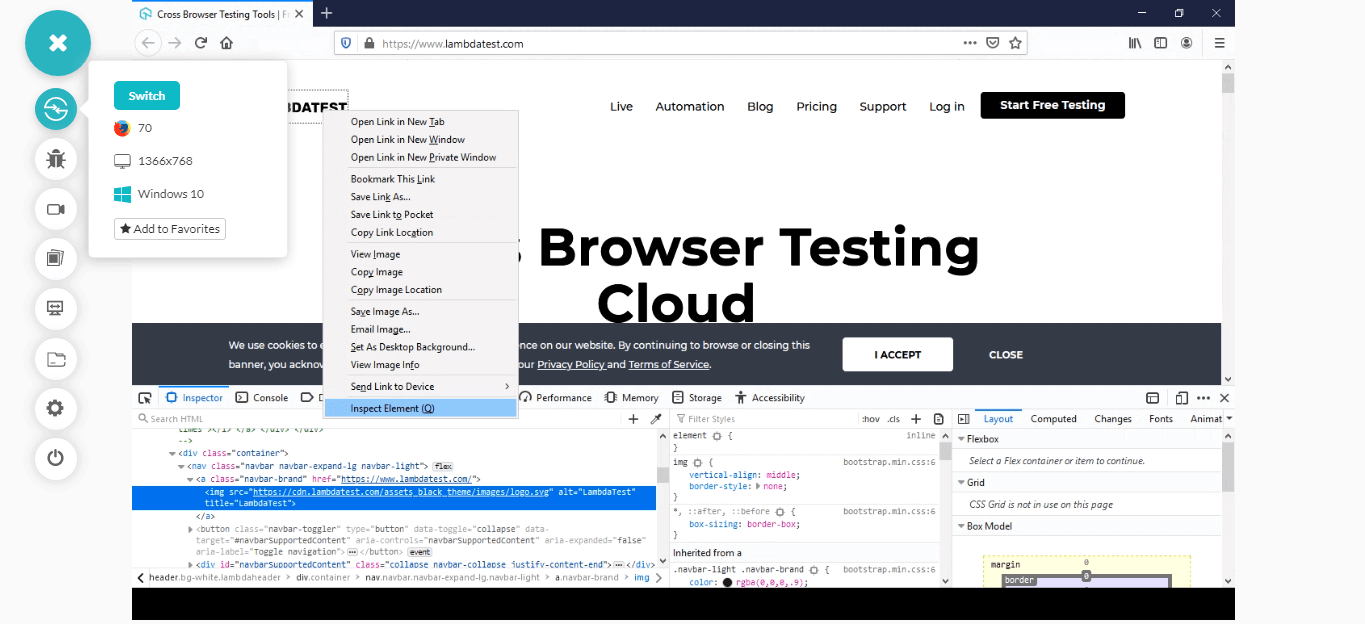
To open Developer tools in Mozilla Firefox, go to the website and right-click on the element you wish to debug. Then select Inspect Element.
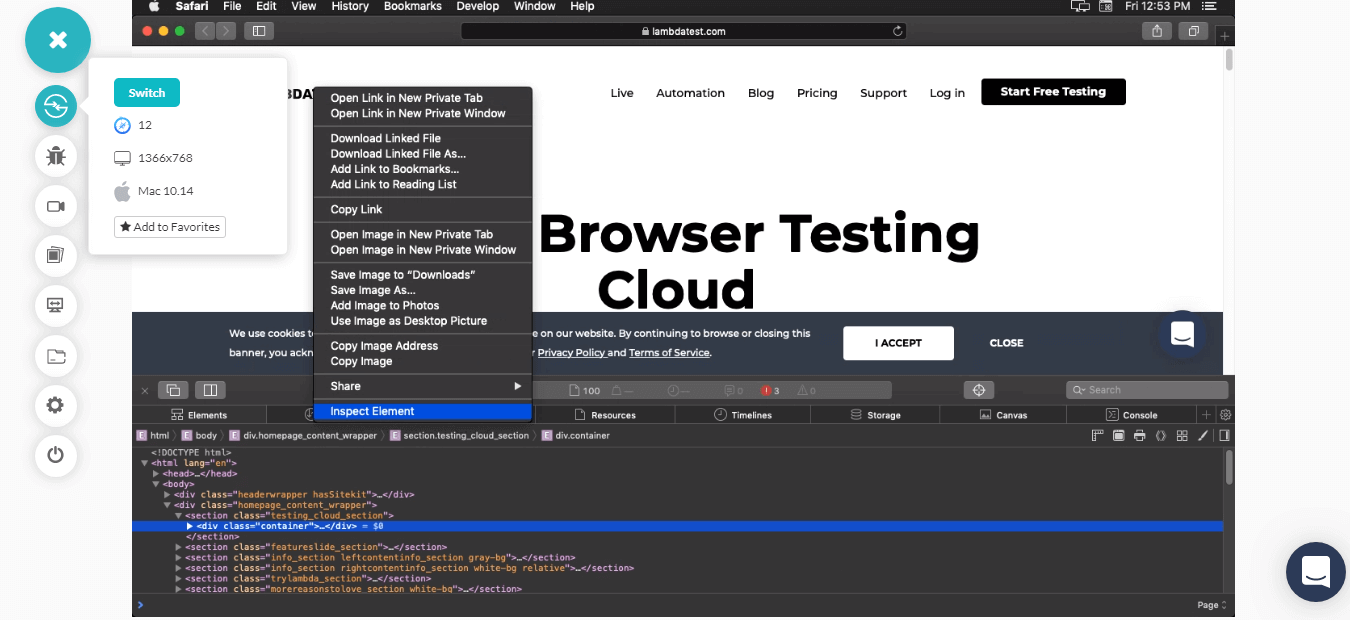
Similarly, to open Developer tools in Safari, go to the website and right-click on the element you wish to debug. Then select Inspect Element.
For this post, as I mentioned, we will stick to Google Chrome. Without further ado, let us look into the 16 tips to use Chrome Dev Tools for better cross browser testing.
Watch this video to learn how to emulate network conditions in Selenium WebDriver by using the ChromeDevTools Protocol.
Tip #1: Finding an Element
This feature helps the tester/developer find any element on a webpage in the source code. Open your Chrome Dev Tools & visit the “Elements” tab. Once you are in the Elements section, press Ctrl + F (Cmd + F). This will open an input box where you can enter the element you desire to find and the tool will highlight it for you.
Tip #2: Add and Edit CSS Elements Directly
Chrome Dev Tools let you add the CSS elements into the code. You can even edit these CSS elements directly from the console.
That way, you can make changes to the styling of your web page instantly. These changes would only be applicable on your browser for a particular session. So once you reload the page the changes would be reverted.
Tip #3: Change Position Of Elements
In the Elements tab of the developer tool, you can change the position of the elements by simply dragging and dropping to the required position. This will show you the updated code’s rendered output on the screen.
Thay way, you can restructure and experiment with the current webpage to evaluate where your content fits best.
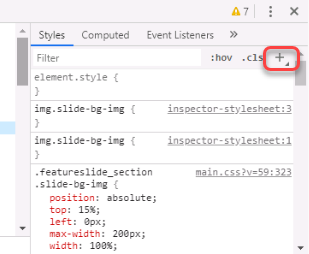
Tip #4: Locate CSS Property In Sources
Many times a tester needs to find a property in Sources which is defined in the Elements to make some changes to it. They can achieve this quickly with Ctrl + Click (Cmd + Click). You can then visit Sources to find the property highlighted.
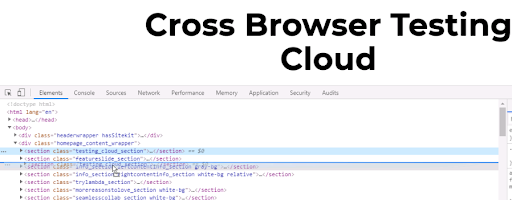
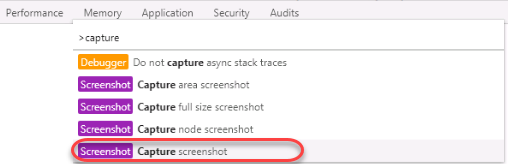
Tip #5: Screenshot An Element
The developer and tester can take a screenshot of an element. To capture a screenshot of an element through Chrome Dev Tools, select the element and then press Ctrl + Shift + P (Cmd + Shift + P). This will open up the command console which accepts various commands. Enter CAPTURE SCREENSHOT as the command to take a screenshot of the element.
Tip #6: Continue Console Operation
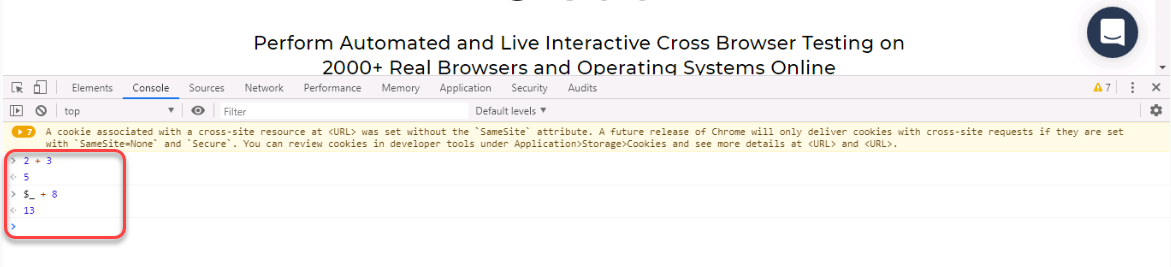
While working on the console, you might have noticed that every new line gives a certain output which depends on the expression you defined in the previous line. With Google Chrome Dev Tools, you can use this output on your next expressions by referring to it as “$_”.
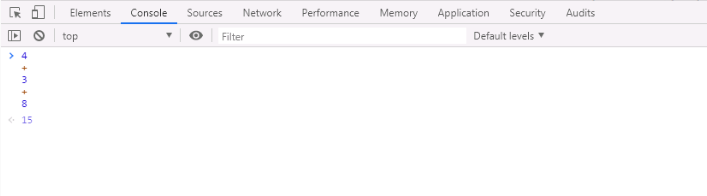
Tip #7: Multi-Lines Scripting Feature in the Console
The console in any software or operating system normally gives an output of the previous expression on every new line. The developer console also works similarly. However, in Chrome Dev Tools Console, a tester can choose to go for multi-line scripting in the console. To enable the multi-line scripting feature, press Shift + Enter.
The console tab is bound to get clustered with various logs. To clear the console, you need to press Ctrl + L (Cmd + K).
Hey! Did you know? Using the boolean script-defer attribute allows the external JavaScript file to run when the DOM is loaded, without delaying page load first.
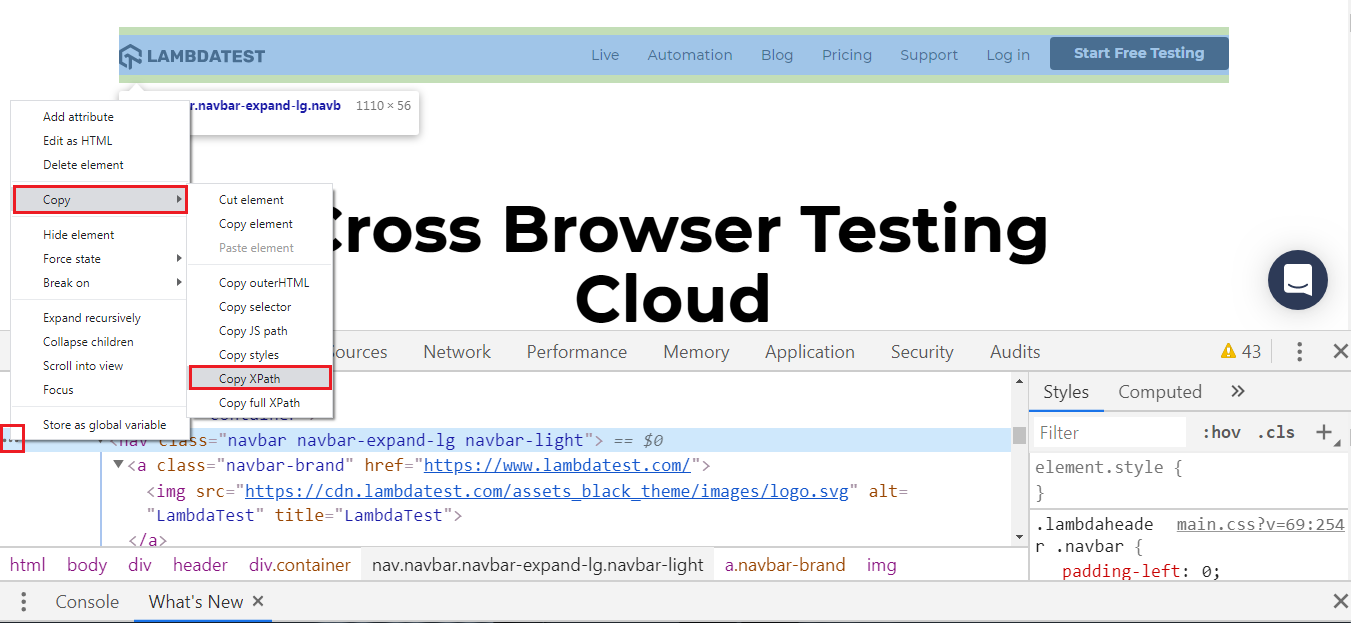
Tip #8: Locators For Selenium Automation Testing
For automation testers, Chrome developer tools have become imperative. While you are performing Selenium automation testing, location elements are crucial to help direct your WebDriver to the correct element. Locators in Selenium helps you to accomplish that. Using Locators, you can locate a specific web element over a web page. Below are the types of locators in Selenium.
ID
Name
Linktext
Partial Linktext
Tag Name
Class Name
CSS Selector
Xpath
Using Google Chrome developer tools, you can find the necessary input for these locators. For example, if you wish to leverage the XPath of a web element, you can copy it using the developer tools and feed it to your Selenium automation scripts.
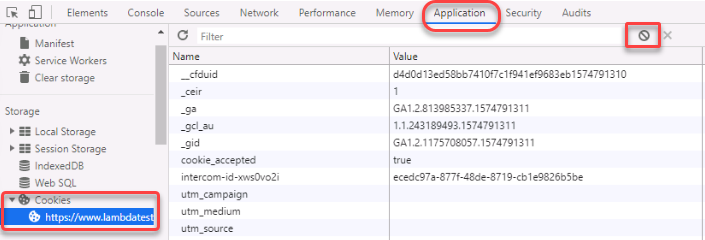
Tip #9: Clear Cookies
Testing any third party applications creates a lot of cookies while debugging. Since debugging requires executing the script multiple times, cookies can interfere with the actual result. So, these need to be cleared. Although Google Chrome provides an option in the Settings to do this, the tester can save time and quickly clear all the cookies from the developer tool only for that specific website or webpage.
To clear the cookies, go to Applications -> Cookies and clear all the cookies or only specific ones.
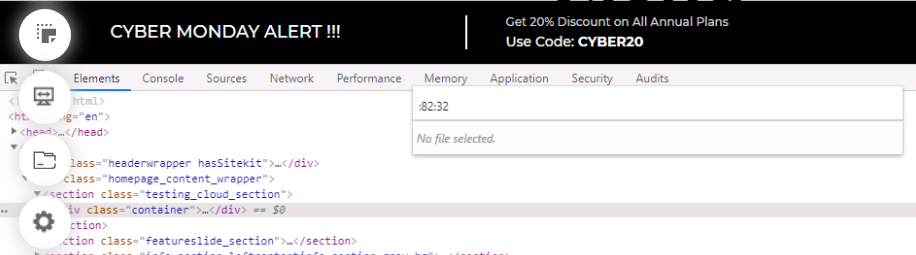
Tip #10: Reach Specific Line and Column Directly
You can reach a specific line and column directly in the Chrome Dev Tools through the panel. You can open the panel to enter the line and column name by pressing Ctrl + O (Cmd + O).
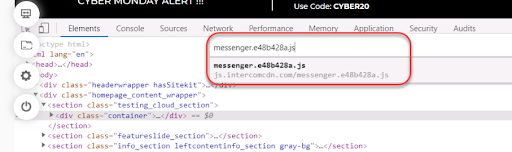
Tip #11: Switch Files Within Project
A web-based project contains many files within. As a web tester or web developer, you may need to switch between these files many times during the integration testing or even unit testing phase. Developer tools provide quick file switching within the project by just typing the name of the file in the panel.
The panel can be opened by pressing Ctrl + P (Cmd + P).
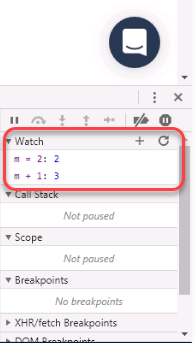
Tip #12: Watch Expression
Chrome Developer Console provides a feature called watch expression. This feature is located in the “Sources” tab in the right column. A tester needs to keep an eye on a variable or expression a lot of times during the debugging phase. Finding, again and again, takes a lot of time. By watch expression feature, the Chrome Dev Tools do that for you. The tester needs to enter the expression or variable in the section and it gets updated every time there is any change.
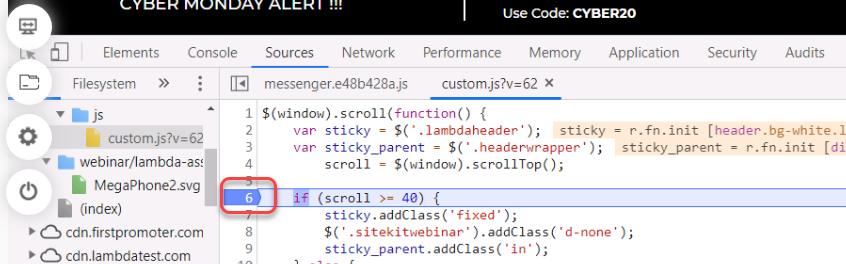
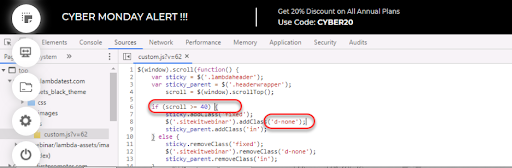
Tip #13: JavaScript Breakpoints
For a typical website, JavaScript codes are long. With so many values changing on a single request, the tester needs to locate and observe them for better testing. For example, an API request using AJAX might run 4 times and provide different status codes. This needs to be checked at every point to test efficiently. For this, developer tools provide a feature called JavaScript Breakpoints. Using JavaScript Breakpoints, you can define the particular line of code where you wish to halt the execution. To apply a JavaScript breakpoint, simply click on the line where you need your JavaScript code execution to stop.
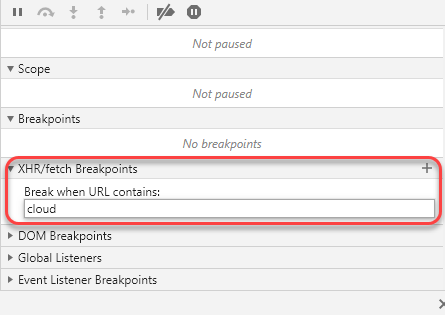
Tip #14: XHR/Fetch Breakpoints
The “Sources” tab contains the XHR/Fetch Breakpoint section below Watch Expression. With this, you can set a breakpoint in the script any time an XHR/Fetch request is sent. The tester is also free to use this feature only on specific XHR/Fetch requests with specific URLs.
Tip #15: Initialise Multiple Cursors
Wouldn’t it be cool to write on different lines simultaneously? Well, Google Chrome Developer Tools allow a tester to achieve that by initializing multiple cursors. Multiple cursors can be initialized by pressing Ctrl + Click (Cmd + Click). Once the cursors are initialized, whatever you write, will be written in all the places.
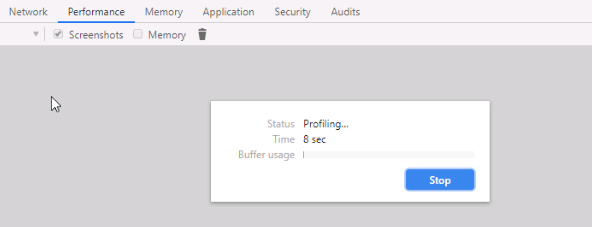
Tip #16: Monitor Performance
Google Developer tool allows the tester to monitor the performance of the website directly from the tool. This helps the tester validate the resources that are being used such as time, activity and source. For monitoring the performance of a webpage, you would need to visit the performance tab in the Chrome Dev Tools and press Ctrl + E (Cmd + E) and then press Ctrl + R (Cmd + R) to reload the page. Hit the stop button to halt the performance monitoring.
You can also refer to the below tutorial on how to perform responsive testing using chrome dev tools protocol In Selenium 4.
Do you know what srcset does? The srcset attribute gives the browser more information about an image and lets you provide a different image source depending on how the image will be displayed.
What If I Told You Can Access Chrome Dev Tools On LambdaTest While Cross Browser Testing?

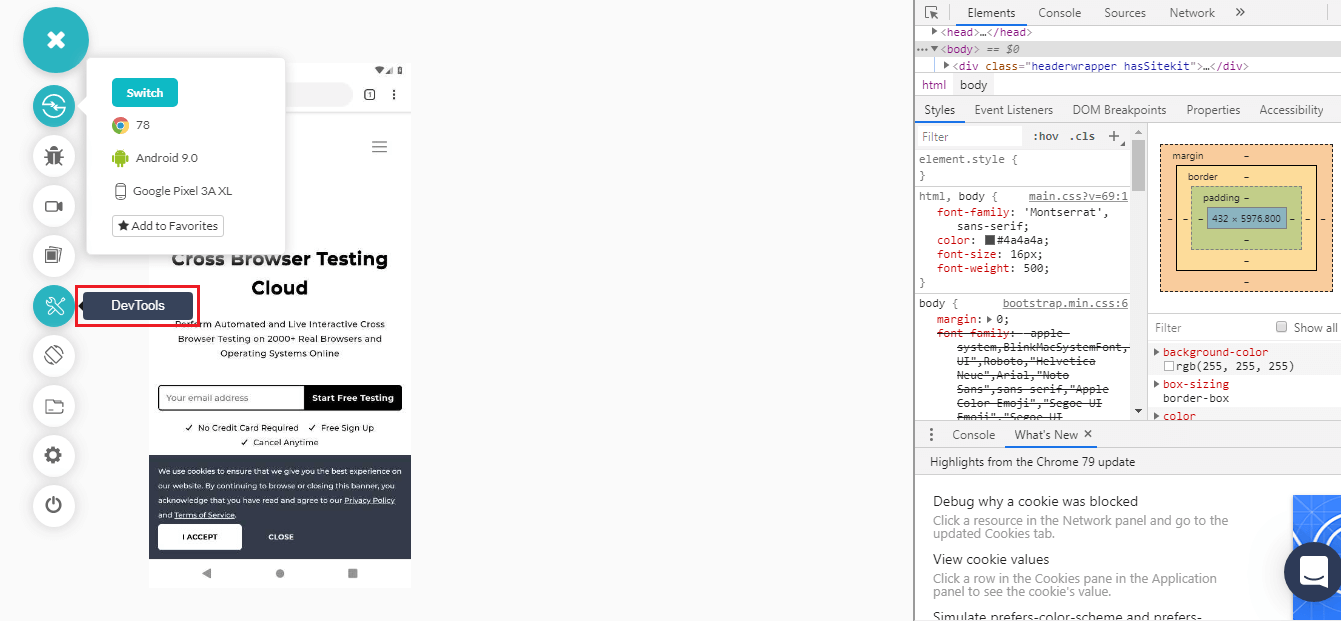
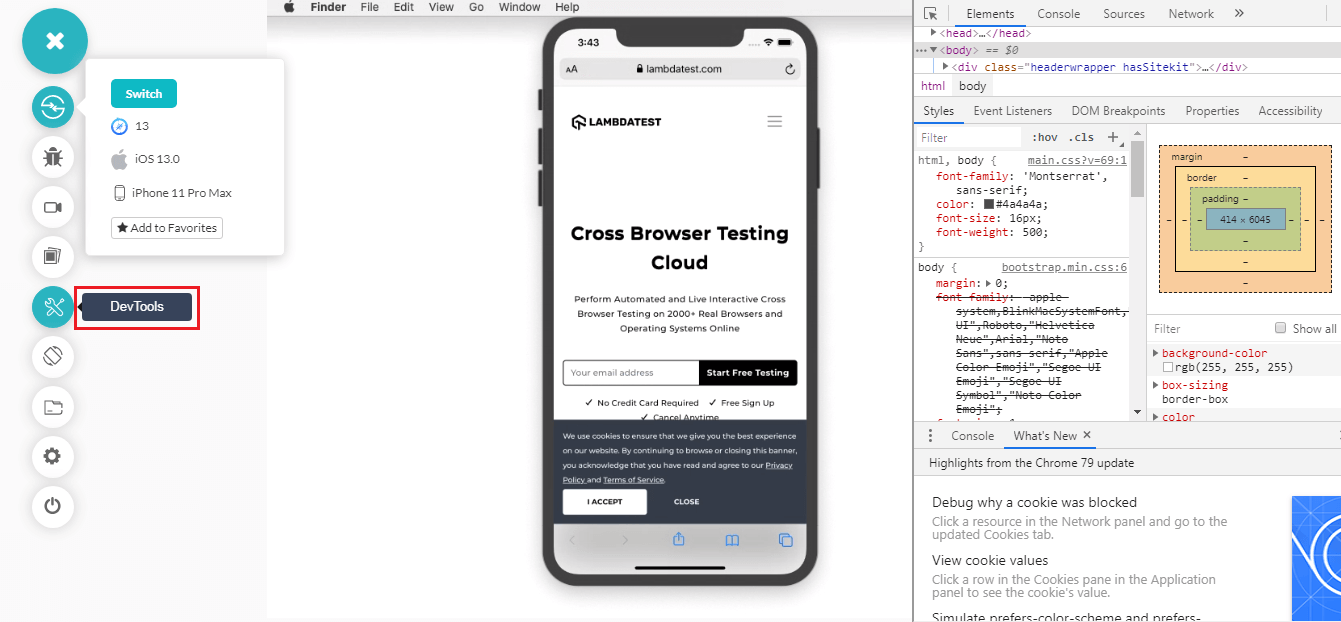
All of the images displayed in the article were taken from using Google Chrome browsers provided by LamdaTest. LambdaTest provides an easy and quick way to access the developer tools in Google Chrome, as well as other browsers such as Mozilla Firefox, Opera, Safari, Internet Explorer, Edge, Yandex. You can even open developer tools over Android and iOS browsers while cross browser testing.
For desktop browsers, you can access Developer Tools using the same way as we saw above. Just right-click and inspect. For mobile browsers, you will find an option inside the controller buttons on the left.
Make sure to incorporate Developer Tools a part of your cross browser testing checklist while browser compatibility testing with LambdaTest. Happy testing! 🙂